Row Crops

Agricultural statistics are presented in table, graph and map form below. For related resources on monitoring, managing and planning for agricultural drought, scroll down or click here.

Agriculture Affected by Drought for Dec 16, 2025

Commodity % Area Affected by Drought
Barley production51
Corn production32
Cotton production51
Durum Wheat production19
Peanut production82
Rice production64
Sorghum production17
Soybean production32
Spring Wheat production16
Sugarbeet production27
Sugarcane production55
Sunflower production2
Winter Wheat production36

Data Table

Data Table

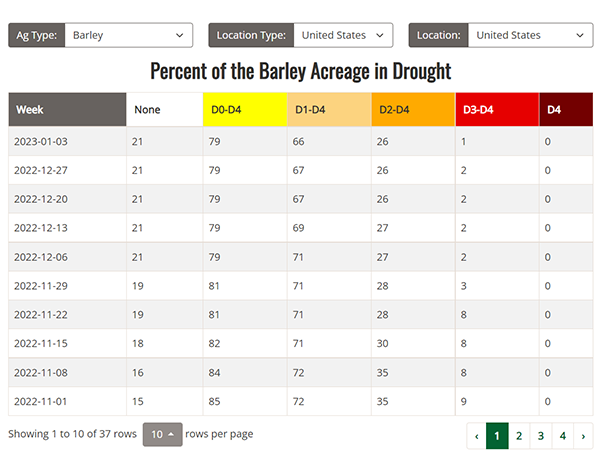
View data tables for the percent of each crop or livestock area affected by drought, organized by U.S. Drought Monitor category, state and week.

Time Series

Data Graph

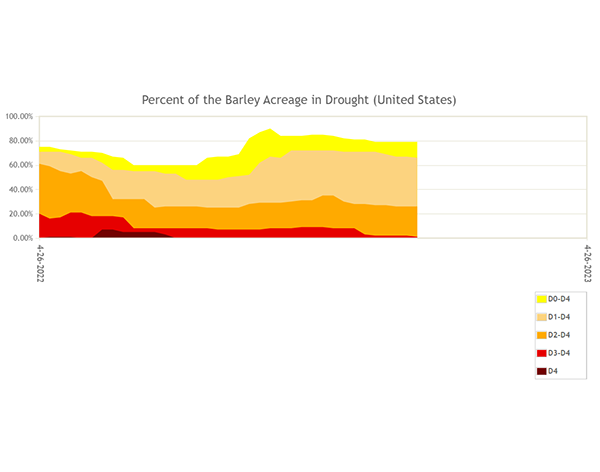
View time series graphs for the percent of each crop or livestock area affected by drought over time, organized by U.S. Drought Monitor category and state.

Maps

Map Viewer

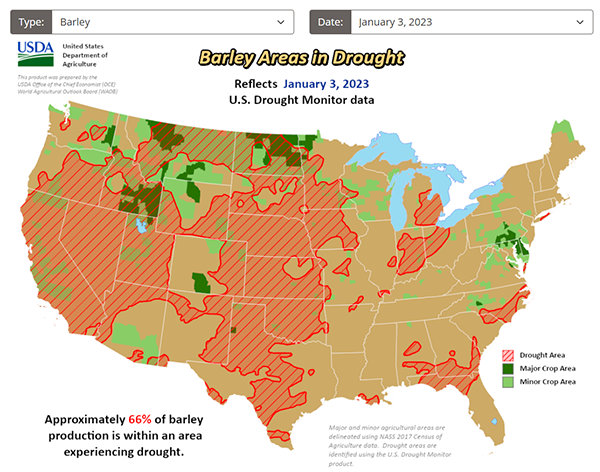
View a national map of each crop or livestock area overlaid with current drought conditions on the most recent the U.S. Drought Monitor.

  • USDA Crop Progress & Conditions Reports – Access state-level reports on harvesting progress, soil moisture, pasture and livestock and crop conditions.
  • USDA Weekly Weather & Crop Bulletin – Check out weather and crop conditions each week, both nationally and with state-by-state detail.
  • Additional Crop Weather Resources – Learn more about current weather conditions, forecasts and irrigation schedules.
  • CMOR – Use Condition Monitoring Observer Reports (CMOR) to tell us how drought is affecting you and to see what others are saying (photos are encouraged but optional).